Tiling BruitParif data with QGIS
Posted on June 29, 2019 in OpenData • 2 min read
BruitParif, the organism in charge of evaluating noise pollution in Paris area, publishes a map with measured noise levels in Paris. This map is however not reusable easily elsewhere, but they offer to download it as opendata shape files (SHP files). Let us see how to quickly export raster tiles to use with Leaflet from these shape files and QGIS.
Let us start from their opendata shape file. After unzipping it, we can load it in QGIS, adding a new vector source and following this doc. This will load all the vector data in QGIS.
Now, let us quickly reproduce the carto.bruitparif.fr style, going to the
layer style properties and adding styles based on the columns data (noise
level). My QGIS project is available at
https://tiles.phyks.me/bruitparif/bruitparif.qgz.
Then, to generate tiles, one can use the “Tiles XYZ” extension available in from within the extensions manager. In the “Processing toolbox” (Ctrl + Alt + T), a new entry “Generate XYZ tiles” will appear under “TilesXYZ”. You can then customize the extents, zoom levels etc to generate tiles for. Note that tiles generation can be really long.
In the end, you get a folder with all the generated tiles, which you can copy to a webserver and reuse.
For BruitParif noise data for car traffic, I generated tiles between Z=0 and
Z=18 which are available at
https://tiles.phyks.me/bruitparif/{z}/{x}/{y}.png and can be reused anywhere
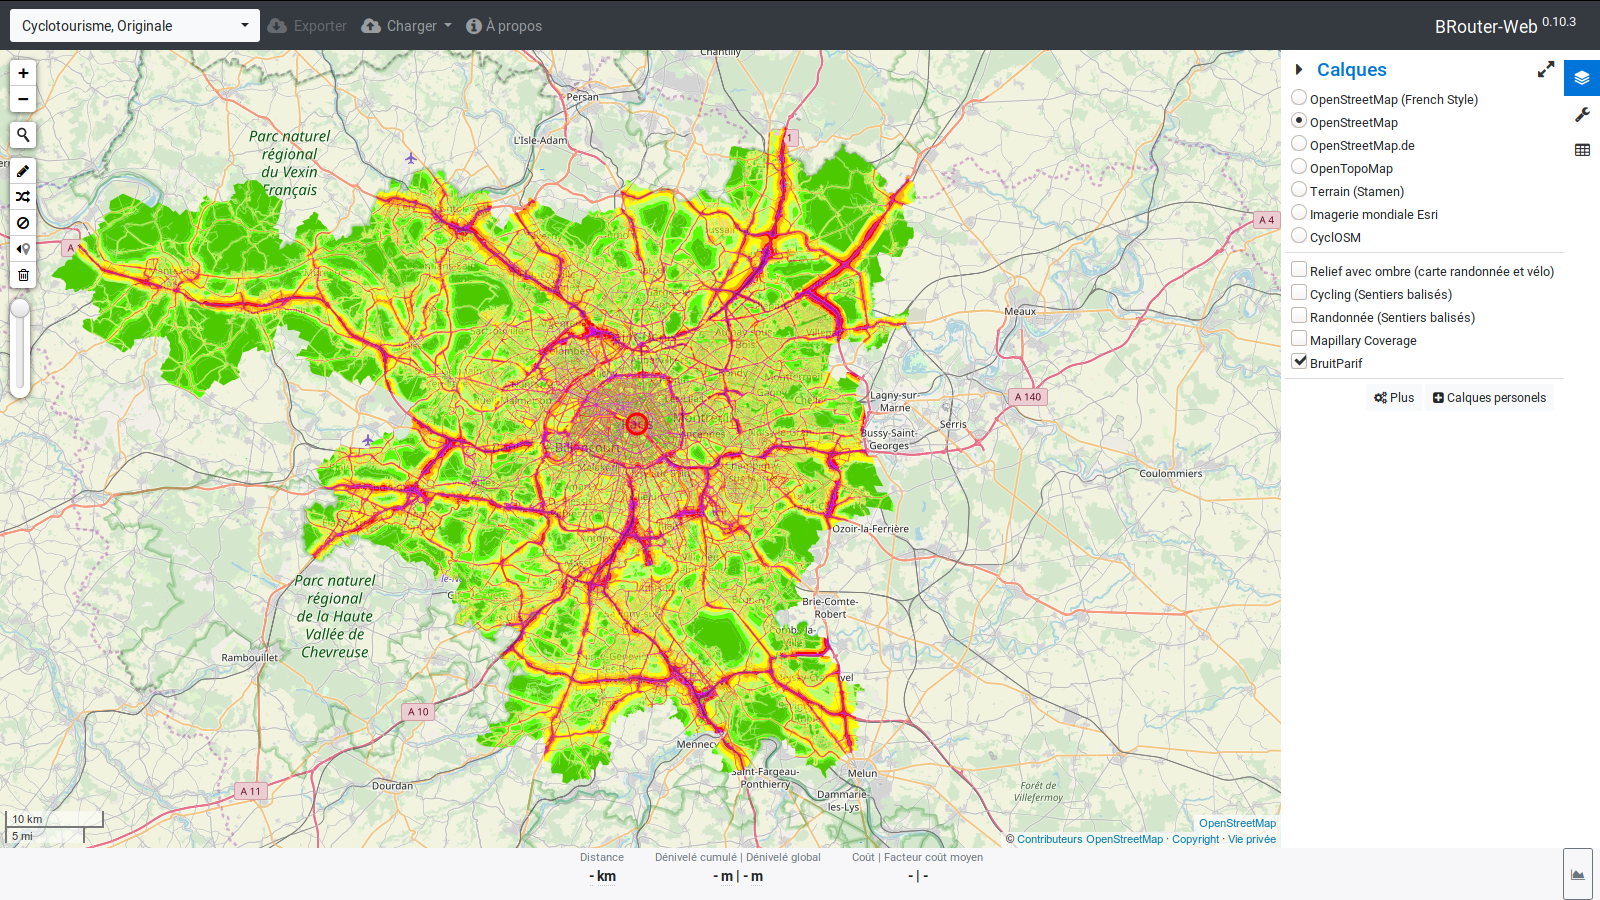
afterwards, such as in BRouter-web. When
generating your own tiles, you can also customize transparency to use these
tiles for overlay. The total tiles between Z=0 and Z=18 weights around
6GB.